Introduction - Natural Resources
Population Variation - Review
Study the graphs below and then read the observations about the data.
|
|
|
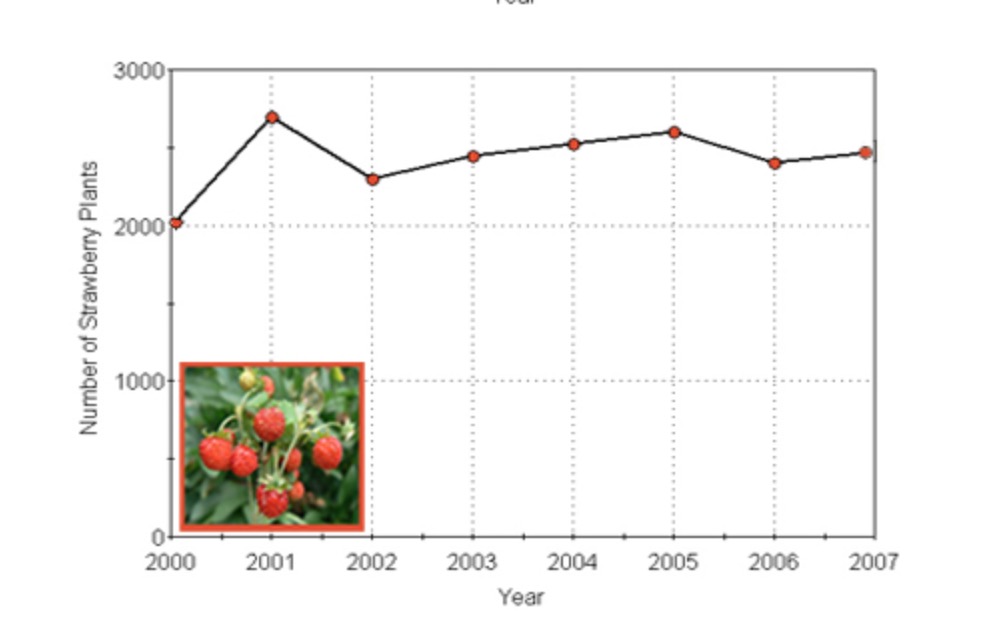
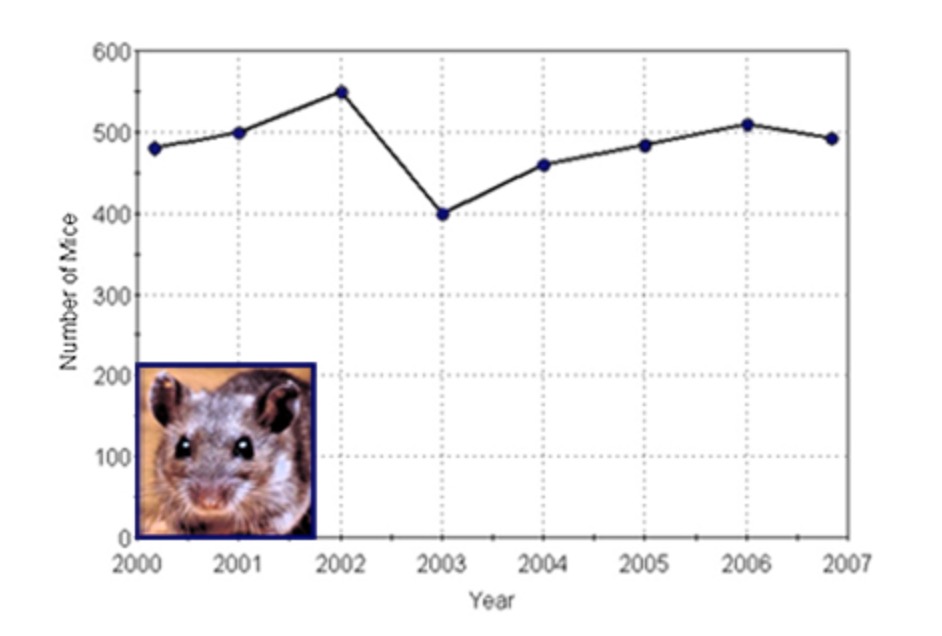
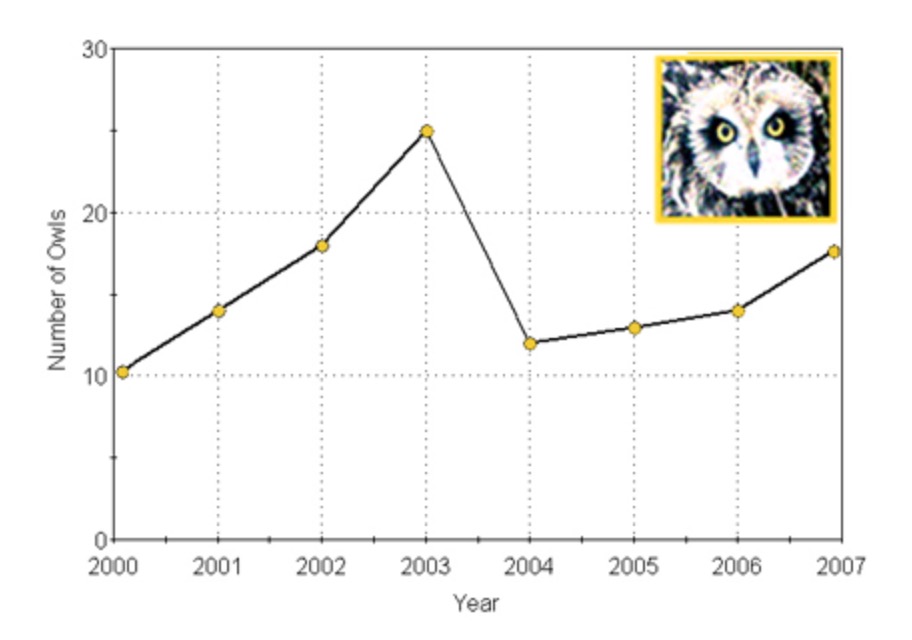
Figures 1-3. Population graphs for deer mouse, wild strawberry plant, and owl for the years 2000 - 2007.
What happened to the wild strawberry plant population?
Observation: The population seemed to grow to a point and then started to go down. It turned down when the population rose above 2,600.
What happened to the deer mouse population?
Observation: The population grew to a point and then started to go down. It turned down when the mouse population rose above 500.
What happened to the owl population?
Observation: The population grew to a point and then started to go down. It turned down when the owl population rose above 20.

|
What can you infer from the data?
Answer the question here. |
